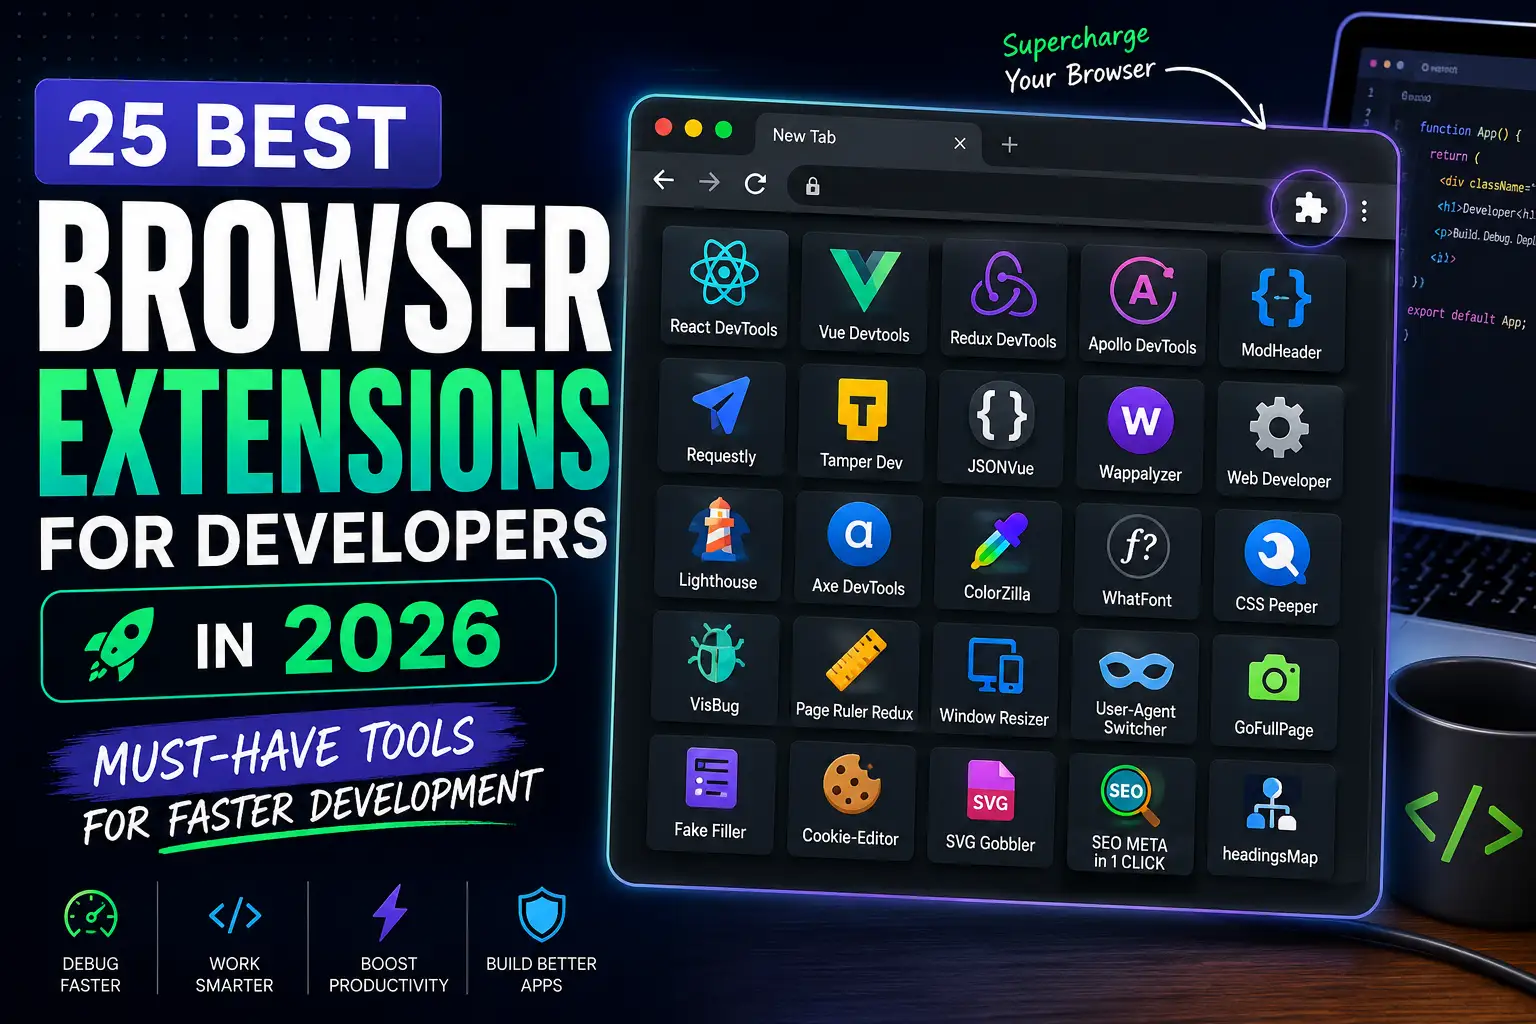
25 Best Browser Extensions for Developers in 2026: Must-Have Tools for Faster Development
Browser extensions sit in a strange middle ground in a developer's toolkit: too often installed impulsively, rarely audited, and wildly underused when actually good. The right set turns your browser into a development environment — inspecting React state, testing API headers, auditing accessibility, debugging CSS layouts, and analyzing network performance without switching tools or writing temporary code. This guide covers 25 extensions that developers actually rely on in 2026, grouped by function, with honest notes on limitations where they exist.
Why Browser Extensions Matter for Modern Web Development
Modern web applications are complex — a React frontend communicates with a Laravel or Node.js API over REST or GraphQL, state flows through Redux or Pinia, and performance budgets tighten with every added dependency. Browser DevTools cover a lot, but extensions bridge the gap between what the browser exposes natively and what developers actually need to debug a hydration mismatch, test a specific HTTP header, or measure real-world accessibility compliance.
Important Note: Every active extension adds a small overhead. A well-chosen set of 8–12 has no perceptible impact. A collection of 40 installed without review will noticeably slow your browser and expand your security surface area.
How to Choose Extensions Without Slowing Down Your Browser
- Install only from the official Chrome Web Store or Firefox Add-ons — avoid sideloaded extensions.
- Check that the extension has an active publisher and a genuine update history, not a cluster of same-day 5-star reviews.
- Prefer minimal permissions — an extension requesting access to all website data to modify only CSS is a warning sign.
- Use Chrome's extension memory profiler (chrome://extensions → Details) to identify resource-heavy extensions.
- Disable, don't uninstall, extensions you use occasionally — they stay available without running on every page load.
All 25 Extensions at a Glance
| # | Extension | Category | Best For | Chrome | Firefox |
|---|---|---|---|---|---|
| 1 | React Developer Tools | Framework Debug | React component tree and state | ✓ | ✓ |
| 2 | Vue.js Devtools | Framework Debug | Vue component tree, Pinia/Vuex | ✓ | ✓ |
| 3 | Redux DevTools | Framework Debug | Redux state time-travel debugging | ✓ | ✓ |
| 4 | Apollo Client DevTools | Framework Debug | GraphQL queries and cache inspection | ✓ | ✓ |
| 5 | ModHeader | API / Network | Injecting custom HTTP request headers | ✓ | ✓ |
| 6 | Requestly | API / Network | Header rules, redirects, mock APIs | ✓ | ✓ |
| 7 | Tamper Dev | API / Network | Intercepting and modifying requests | ✓ | ✗ |
| 8 | JSONVue | API / Network | Formatting raw JSON API responses | ✓ | ✓ |
| 9 | Wappalyzer | Utility | Detecting tech stacks on any site | ✓ | ✓ |
| 10 | Web Developer | Utility | DOM manipulation, CSS tools, validation | ✓ | ✓ |
| 11 | Lighthouse | Performance / Accessibility | Auditing performance, SEO, accessibility | ✓ | ✗ |
| 12 | Axe DevTools | Accessibility | WCAG accessibility violation detection | ✓ | ✓ |
| 13 | ColorZilla | CSS / Design | Color picker and gradient generator | ✓ | ✓ |
| 14 | WhatFont | CSS / Design | Identifying fonts on any webpage | ✓ | ✓ |
| 15 | CSS Peeper | CSS / Design | Inspecting CSS without opening DevTools | ✓ | ✗ |
| 16 | VisBug | CSS / Design | Visual browser editing, spacing, layers | ✓ | ✓ |
| 17 | Page Ruler Redux | CSS / Design | Measuring pixel distances on screen | ✓ | ✓ |
| 18 | Window Resizer | Responsive Testing | Testing responsive breakpoints | ✓ | ✓ |
| 19 | User-Agent Switcher | Responsive Testing | Simulating mobile and bot user agents | ✓ | ✓ |
| 20 | GoFullPage | Utility | Full-page screenshots for QA and sharing | ✓ | ✓ |
| 21 | Fake Filler | Utility | Auto-filling forms with realistic dummy data | ✓ | ✓ |
| 22 | Cookie-Editor | Utility | Viewing, editing, and deleting cookies | ✓ | ✓ |
| 23 | SVG Gobbler | Utility | Extracting SVG assets from any webpage | ✓ | ✓ |
| 24 | SEO META in 1 CLICK | SEO | On-page SEO analysis in one panel | ✓ | ✓ |
| 25 | headingsMap | Accessibility / SEO | Visualizing heading hierarchy on any page | ✓ | ✓ |
Detailed Reviews: The 25 Best Browser Extensions for Developers
Framework Debugging
1. React Developer Tools
What it does: Adds Components and Profiler panels to DevTools — giving direct access to the React component tree, props, state, hooks, and render timing on any React-powered page.
Best use cases: Debugging a Next.js application's server-side props, tracing unnecessary re-renders, inspecting context values without temporary console.log calls.
Best Pick: Non-negotiable for any React developer. The Profiler tab alone saves hours identifying unnecessary re-renders in production-scale applications.
2. Vue.js Devtools
What it does: Provides a full panel for inspecting Vue component hierarchies, Pinia or Vuex state, routing, and custom events — for both Vue 2 and Vue 3.
Best use cases: Inspecting Pinia store mutations in a Vue 3 SPA, debugging component props passed through deeply nested slots.
3. Redux DevTools
What it does: Enables time-travel debugging for Redux state — stepping forward and backward through actions to see exactly how state changed at each point.
Best use cases: Reproducing a complex checkout flow bug by stepping through the exact sequence of dispatched actions that led to the broken state.
4. Apollo Client DevTools
What it does: Adds a GraphQL panel showing active queries, mutations, cache contents, and query timing for Apollo Client applications.
Best use cases: Debugging overfetching, inspecting cache normalization, testing queries against a live schema without opening GraphQL Playground separately.
API and Network Tools
5. ModHeader
What it does: Injects custom HTTP request and response headers into browser traffic, with profile switching for different environments.
Best use cases: Testing a Laravel API behind an authentication header, simulating CDN cache bypass headers, testing CORS behavior with specific origin values.
Security Tip: Disable ModHeader profiles when not actively testing — an always-on header rule can interfere with authentication on other sites you visit.
6. Requestly
What it does: A more powerful network tool supporting redirect rules, response mocking, request delays, and script injection — shareable as team rule sets.
Best use cases: Redirecting production API calls to a local development server without changing application code; mocking API endpoints that don't exist yet while frontend development continues.
| Feature | ModHeader | Requestly |
|---|---|---|
| Header injection | ✓ | ✓ |
| Request redirects | ✗ | ✓ |
| Response mocking | ✗ | ✓ |
| Team sharing | ✗ | ✓ (paid) |
| Script injection | ✗ | ✓ |
| Best for | Quick header overrides | Full request interception |
7. Tamper Dev
What it does: Intercepts network requests in real time, allowing you to edit request payloads, response bodies, and headers before they reach the application. Invaluable for testing how the frontend handles edge-case API responses — null values, empty arrays — without server changes.
8. JSONVue
What it does: Automatically formats raw JSON responses in the browser into syntax-highlighted, collapsible trees — eliminating the need to copy responses into an external formatter during Laravel or Node.js API development.
CSS and Design Tools
9. ColorZilla
What it does: Samples any pixel on screen and copies the hex, RGB, or HSL value to the clipboard. Also includes a CSS gradient generator. Use it to match a client's undocumented color or generate gradient CSS visually.
10. WhatFont
What it does: Identifies the font family, size, weight, line height, and color of any text on a page on hover — useful for auditing typography against design specs or identifying a competitor's font stack.
11. CSS Peeper
What it does: Displays the computed CSS of any element in a clean, copyable panel without opening the full DevTools inspector. Faster for extracting component styles from reference sites.
12. VisBug
What it does: A visual browser editing tool for moving elements, adjusting spacing, editing typography, and inspecting layers directly on any live page — like a browser-based design inspector. Useful for presenting visual proposals to clients on a live URL.
| Feature | CSS Peeper | VisBug |
|---|---|---|
| Inspect computed styles | ✓ Clean UI | ✓ In-context |
| Visual editing | ✗ | ✓ |
| Copy CSS values | ✓ | Partial |
| Spacing overlay | ✗ | ✓ |
| Best for | Fast style extraction | Visual prototyping review |
13. Page Ruler Redux
What it does: Draws a pixel ruler overlay on the browser screen to measure exact distances between elements — essential for verifying that padding, margin, and spacing match design specifications during frontend QA.
14. Window Resizer
What it does: Resizes the browser window to common device dimensions with a single click, including custom breakpoints. Useful for testing Tailwind CSS responsive classes across sm, md, lg, and xl viewports without dragging the window manually.
Performance and Accessibility
15. Lighthouse
What it does: Audits any webpage across five categories — Performance, Accessibility, Best Practices, SEO, and Progressive Web App — generating a scored report with actionable recommendations. Critically, it runs against localhost and staging URLs that PageSpeed Insights cannot reach.
| Feature | Lighthouse (Extension) | PageSpeed Insights (Web) |
|---|---|---|
| Runs on localhost | ✓ | ✗ |
| Runs on staging URLs | ✓ | Limited |
| Reproducible conditions | Simulated throttling | Field data + lab data |
| Accessibility audit | ✓ | Partial |
| Best for | Local and staging testing | Real-world CrUX field data |
16. Axe DevTools
What it does: Runs automated WCAG accessibility checks and reports violations with specific element references and fix suggestions — broader rule coverage than Lighthouse's built-in accessibility audit.
| Feature | Axe DevTools | Lighthouse Accessibility |
|---|---|---|
| WCAG rule coverage | Broader | Core subset |
| Element-level guidance | Detailed | General |
| Integration | DevTools panel | DevTools panel |
| Best for | Dedicated accessibility audit | Quick accessibility check as part of a full audit |
Utility and Productivity Tools
17. Wappalyzer
What it does: Detects the technology stack of any website — framework, CMS, CDN, analytics, payment processors, and more. Useful for competitive research and understanding how a client's existing site is built before proposing a migration.
18. Web Developer
What it does: A comprehensive toolbar with over 100 tools: CSS and JavaScript disablers, form inspection, cookie management, image information, and validation shortcuts. Disabling CSS to test semantic HTML structure is one of its most-used features.
19. GoFullPage
What it does: Captures a full-page screenshot including content below the fold as a PNG or PDF — faster than screen recording tools for documenting QA issues with full context.
20. Fake Filler
What it does: Fills all form fields with realistic dummy data — names, emails, addresses — in one click. Eliminates repetitive manual typing when testing multi-step checkout flows or registration forms in a Laravel or React application.
21. Cookie-Editor
What it does: Provides a clean interface for viewing, creating, editing, exporting, and deleting cookies for the current domain. Useful for debugging session authentication issues, testing cookie expiration, and transferring auth cookies between environments.
22. User-Agent Switcher
What it does: Changes the browser's reported User-Agent string to simulate different browsers, devices, and bots. Use it to test mobile-specific layouts or verify how a page serves content to Googlebot without a physical device.
23. SVG Gobbler
What it does: Finds and extracts all SVG assets on a webpage for preview, markup copying, or direct download — useful when reference assets weren't provided in a design file.
24. SEO META in 1 CLICK
What it does: Displays all SEO-relevant metadata in one panel — title, meta description, canonical URL, Open Graph tags, robots directives, and structured data. Essential for pre-launch metadata audits and verifying Open Graph tags render correctly for social sharing.
25. headingsMap
What it does: Visualizes the heading hierarchy (h1 through h6) of any page in a sidebar, flagging skipped levels. Heading structure affects both screen reader navigation and search engine content understanding — making this tool relevant to both accessibility and SEO audits.
Best Extensions by Developer Role
| Role | Recommended Extensions |
|---|---|
| Frontend developer | React/Vue DevTools, VisBug, ColorZilla, WhatFont, Window Resizer, Page Ruler Redux |
| Backend developer | JSONVue, ModHeader, Cookie-Editor, Wappalyzer, Tamper Dev |
| Full-stack developer | React/Vue DevTools, Requestly, JSONVue, Lighthouse, Axe DevTools, Fake Filler |
| API testing | ModHeader, Requestly, Tamper Dev, JSONVue, Cookie-Editor |
| Accessibility testing | Axe DevTools, headingsMap, Lighthouse, Web Developer |
| Performance optimization | Lighthouse, Web Developer, Import Cost (DevTools) |
| SEO auditing | SEO META in 1 CLICK, headingsMap, Wappalyzer, Lighthouse |
Extensions You Probably Don't Need
- Duplicate tab managers — Chrome and Firefox have built-in tab grouping that covers this.
- Multiple screenshot tools — GoFullPage plus native browser shortcuts handle everything.
- Ad blockers in a development profile — Keep a separate personal profile with ad blocking; your dev profile should reflect what real users see.
- Multiple JSON viewer extensions — One is sufficient; two active at once can conflict on the same response.
Expert Recommendation: Create a dedicated browser profile for development work. Extensions in the dev profile stay out of your personal sessions and vice versa.
Frequently Asked Questions
Do browser extensions pose a security risk?
Yes, if chosen carelessly. Extensions can read page content, intercept network requests, and access cookies. Install only from verified publishers with consistent update histories, and remove anything no longer in active use.
Which extensions work across Chrome, Edge, and Firefox?
Most on this list are available on both Chromium browsers and Firefox. Exceptions: Lighthouse is Chrome/Edge only, and Tamper Dev is Chromium-only.
Can extensions break a website during testing?
Yes. Extensions modifying headers or injecting scripts can distort Lighthouse and accessibility scores. Disable non-essential extensions before running audits.
Are there performance costs to running React DevTools and Vue Devtools simultaneously?
Both detect whether their framework is present before activating, so on a React-only page Vue Devtools stays inactive. The overhead of having both installed is negligible.
Is Lighthouse in the browser the same as running it via the CLI?
Functionally similar, but the extension runs with your installed extensions active. For reproducible results, use the Lighthouse CLI or PageSpeed Insights for final pre-launch audits rather than the extension.
Final Verdict
The most productive browser setups in 2026 have the right extensions, not the most. For most developers, eight to ten tools cover everything: a framework inspector, a JSON formatter, a header manager, Lighthouse, Axe DevTools, ColorZilla, Wappalyzer, and one or two role-specific picks. That set adds negligible overhead and avoids the security and performance costs of an unaudited collection.
Key Takeaways
- React Developer Tools and Vue.js Devtools are non-negotiable for their respective frameworks — no other tool provides the same component-level visibility.
- Requestly outperforms ModHeader for complex workflows involving redirects, response mocking, and team-shared rule sets.
- Axe DevTools provides broader WCAG coverage than Lighthouse's accessibility module — run both for thorough compliance checks.
- Use a dedicated browser profile for development so extension overhead stays out of personal sessions.
- Disable extensions before Lighthouse or accessibility audits — injected scripts and headers distort scores.
- Install only from verified publishers with consistent update histories. Permissions reviews are not optional.
References
- React Developer Tools – Chrome Web Store
- React Developer Tools – Firefox Add-ons
- Vue.js Devtools – Chrome Web Store
- Redux DevTools – Chrome Web Store
- Apollo Client DevTools – Chrome Web Store
- ModHeader – Chrome Web Store
- Requestly – Official Website
- Tamper Dev – Chrome Web Store
- JSONVue – Chrome Web Store
- Wappalyzer – Official Website
- Web Developer – Chrome Web Store
- Lighthouse – Chrome Web Store
- Axe DevTools – Official Site (Deque Systems)
- ColorZilla – Chrome Web Store
- WhatFont – Chrome Web Store
- CSS Peeper – Chrome Web Store
- VisBug – Chrome Web Store
- Page Ruler Redux – Chrome Web Store
- Window Resizer – Chrome Web Store
- GoFullPage – Official Website
- Fake Filler – Chrome Web Store
- Cookie-Editor – Official Website
- SVG Gobbler – Official Website
- SEO META in 1 CLICK – Chrome Web Store
- headingsMap – Chrome Web Store
- Chrome Extensions – Official Google Developer Documentation
- Firefox Add-ons – Mozilla Developer Network (MDN)
Comments
0 comments
No comments yet
Start the discussion with a thoughtful note.